Confronting the Datacenter Delay Dilemma
Why Cutting Corners Can Cost Billions

Executive Summary & Key Findings
Dario Amoei has promised a “country of geniuses” in a datacenter. However, Anthropic’s popular models have suffered frequent outages due to compute constraints. Increasing the supply of datacenters to provide that compute is primarily bottlenecked by power availability. How does the AI industry reliably deliver on their potential and what is the cost if it is delayed?
In late 2025, a 60-day construction delay at CoreWeave’s 260 MW datacenter in Denton, Texas, caused by rainstorms and design revisions, contributed to a 62% stock decline and $33 billion in lost market capitalization over subsequent months, and was cited in class- action lawsuits. CoreWeave’s capex guidance was reduced from a reported $20-23 billion range to $12-14 billion. Two months of delay on a single project reshaped the entire company’s financial trajectory.
CoreWeave is not an outlier. In 2025, 26% of datacenter projects expected to come online slipped their schedules. U.S. datacenter construction fell for the first time since 2020, dropping from 6.35 GW to 5.99 GW under construction, as permitting, zoning, and power procurement delays mounted [1]. Close to half of the planned U.S. datacenter builds in 2026 are projected to be delayed or canceled due to various constraints accessing power including supply chain, grid availability, and permitting [2]. Access to power has clearly become the bottleneck for Datacenter buildout ambitions.
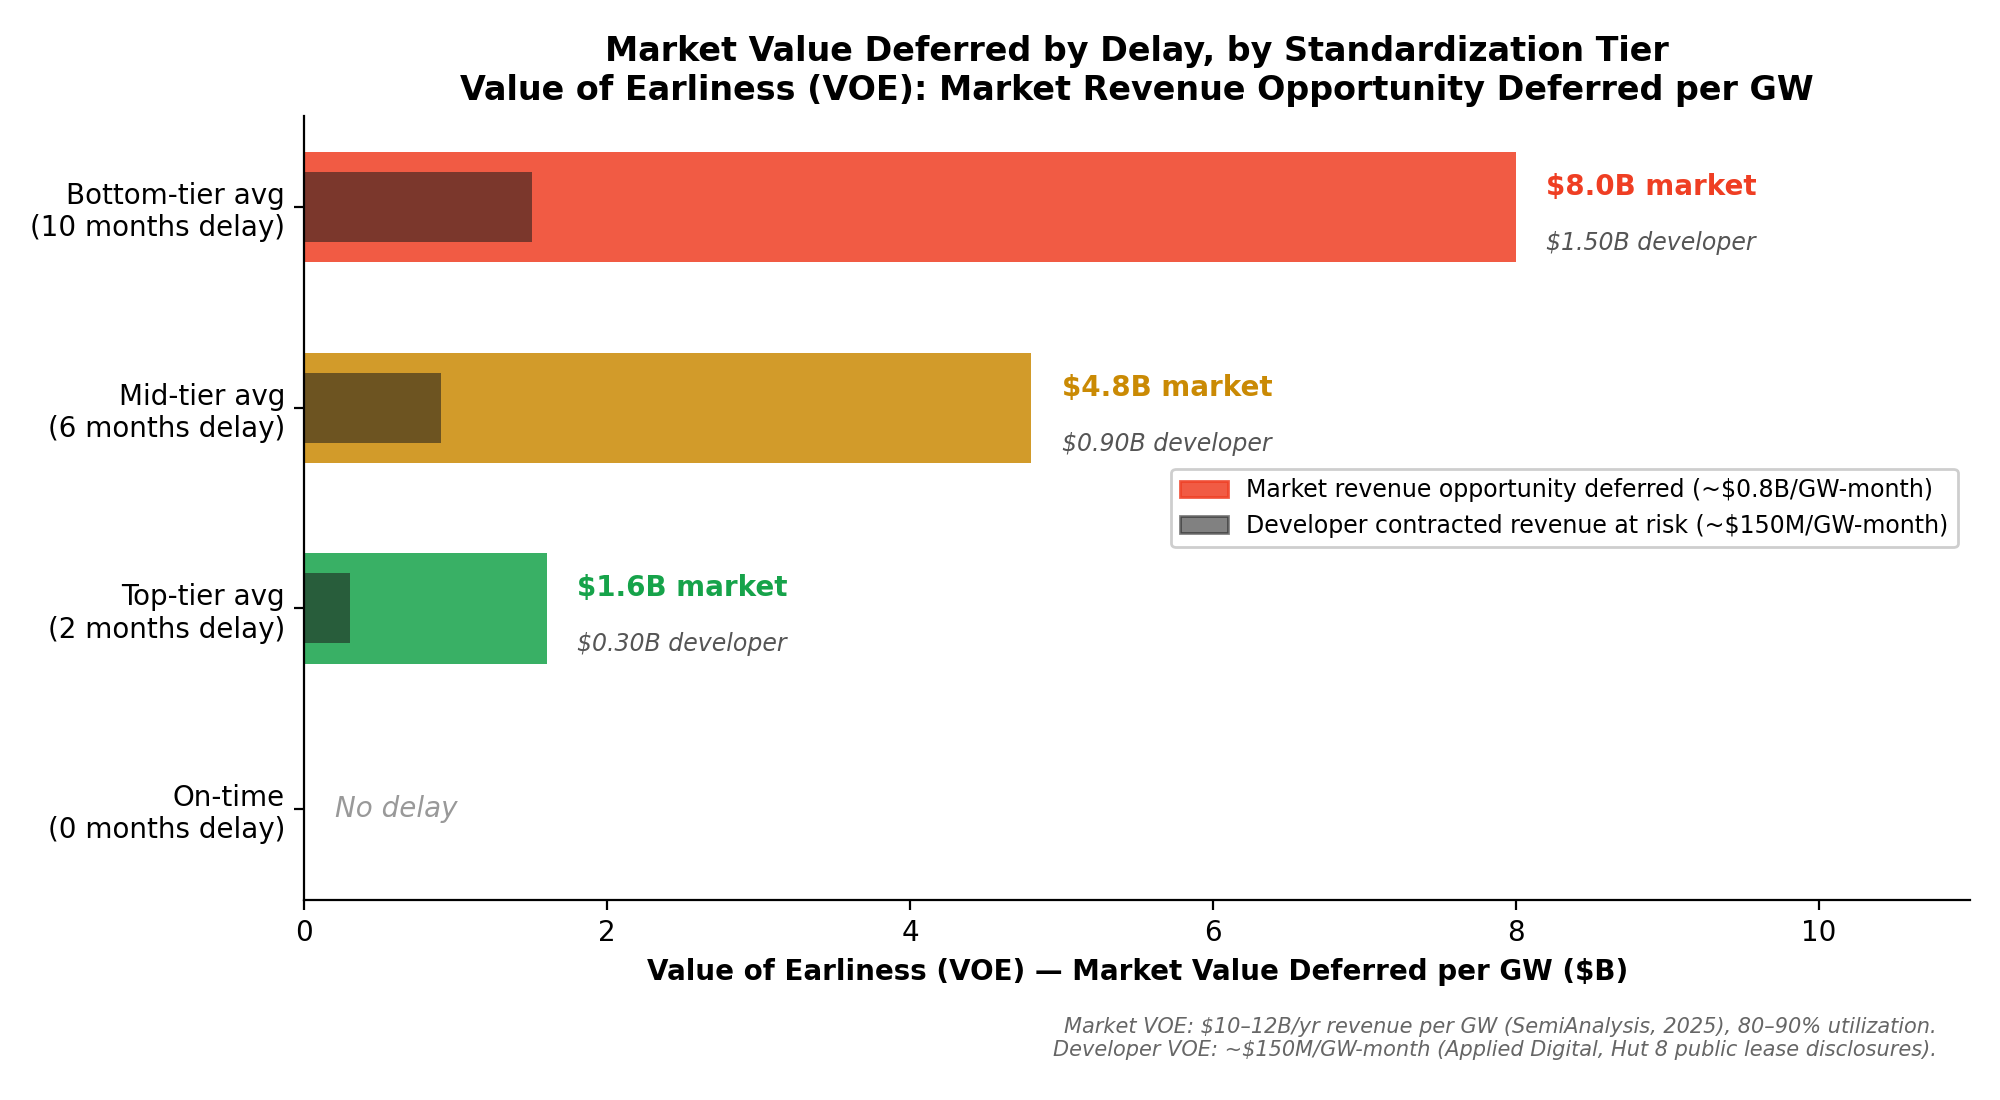
The financial stakes are enormous. A deployed gigawatt of AI inference capacity generates an estimated $10-12 billion per year in end-market revenue [3]. Each month a 1 GW campus is delayed defers roughly $0.7-0.9 billion of that market revenue opportunity (assuming 80-90% utilization). At the infrastructure layer, public AI datacenter lease disclosures imply developer-side contracted revenue at risk on the order of ~$150 million per GW-month, before financing carry and delay credits. A 1 GW project that runs ~10 months late, the average for bespoke projects in our database, defers $7-9 billion in market revenue opportunity.
Yet, the industry has no consensus on how to avoid these delays. Some operators have tried to outrun the problem by building novel “behind-the-meter”/ “off-the-grid” micro-grids that rely less on the often slow process of interconnecting to the grid and permitting. xAI deployed 300 MW in Memphis in four months by bypassing environmental permitting entirely-and now faces Clean Air Act litigation (see Section 3.2 for details). Others have been paralyzed by process. Microsoft spent roughly six years navigating California’s permitting process for a 100 MW facility in San Jose that is still not built.
Meanwhile, in Western Australia, a 56 MW hybrid microgrid at the Agnew Gold Mine was delivered in approximately 12 months across two construction phases, on time, on budget, with no reported regulatory issues and a government award for environmental excellence. It was the third project its operator had built using the same modular design. In that same period, the Australian mining sector deployed over 500 MW of hybrid power across five remote sites, with most permitted in under 12 months.
What design and execution methods actually minimize the risk and cost of datacenter project delays?
Through Occam Edge’s proprietary process we assembled evidence from 18 comparable “micro-grids” represented by islanded power projects, spanning datacenter campuses, power shells of LNG mega-projects, and industrial microgrids globally, and tested whether the way these systems are designed, permitted, and procured makes a measurable difference to delivery outcomes. To quantify this, Occam Edge developed a proprietary Standardization Score that evaluates each project across five dimensions: design reuse, modular/factory-built assembly, permitting pre-certification, multi-source procurement, and interface standardization. The answer, across every analysis we ran, points in the same direction.
Headline findings
01 Projects with higher standardization scores consistently delivered faster and more predictably in our project samples.
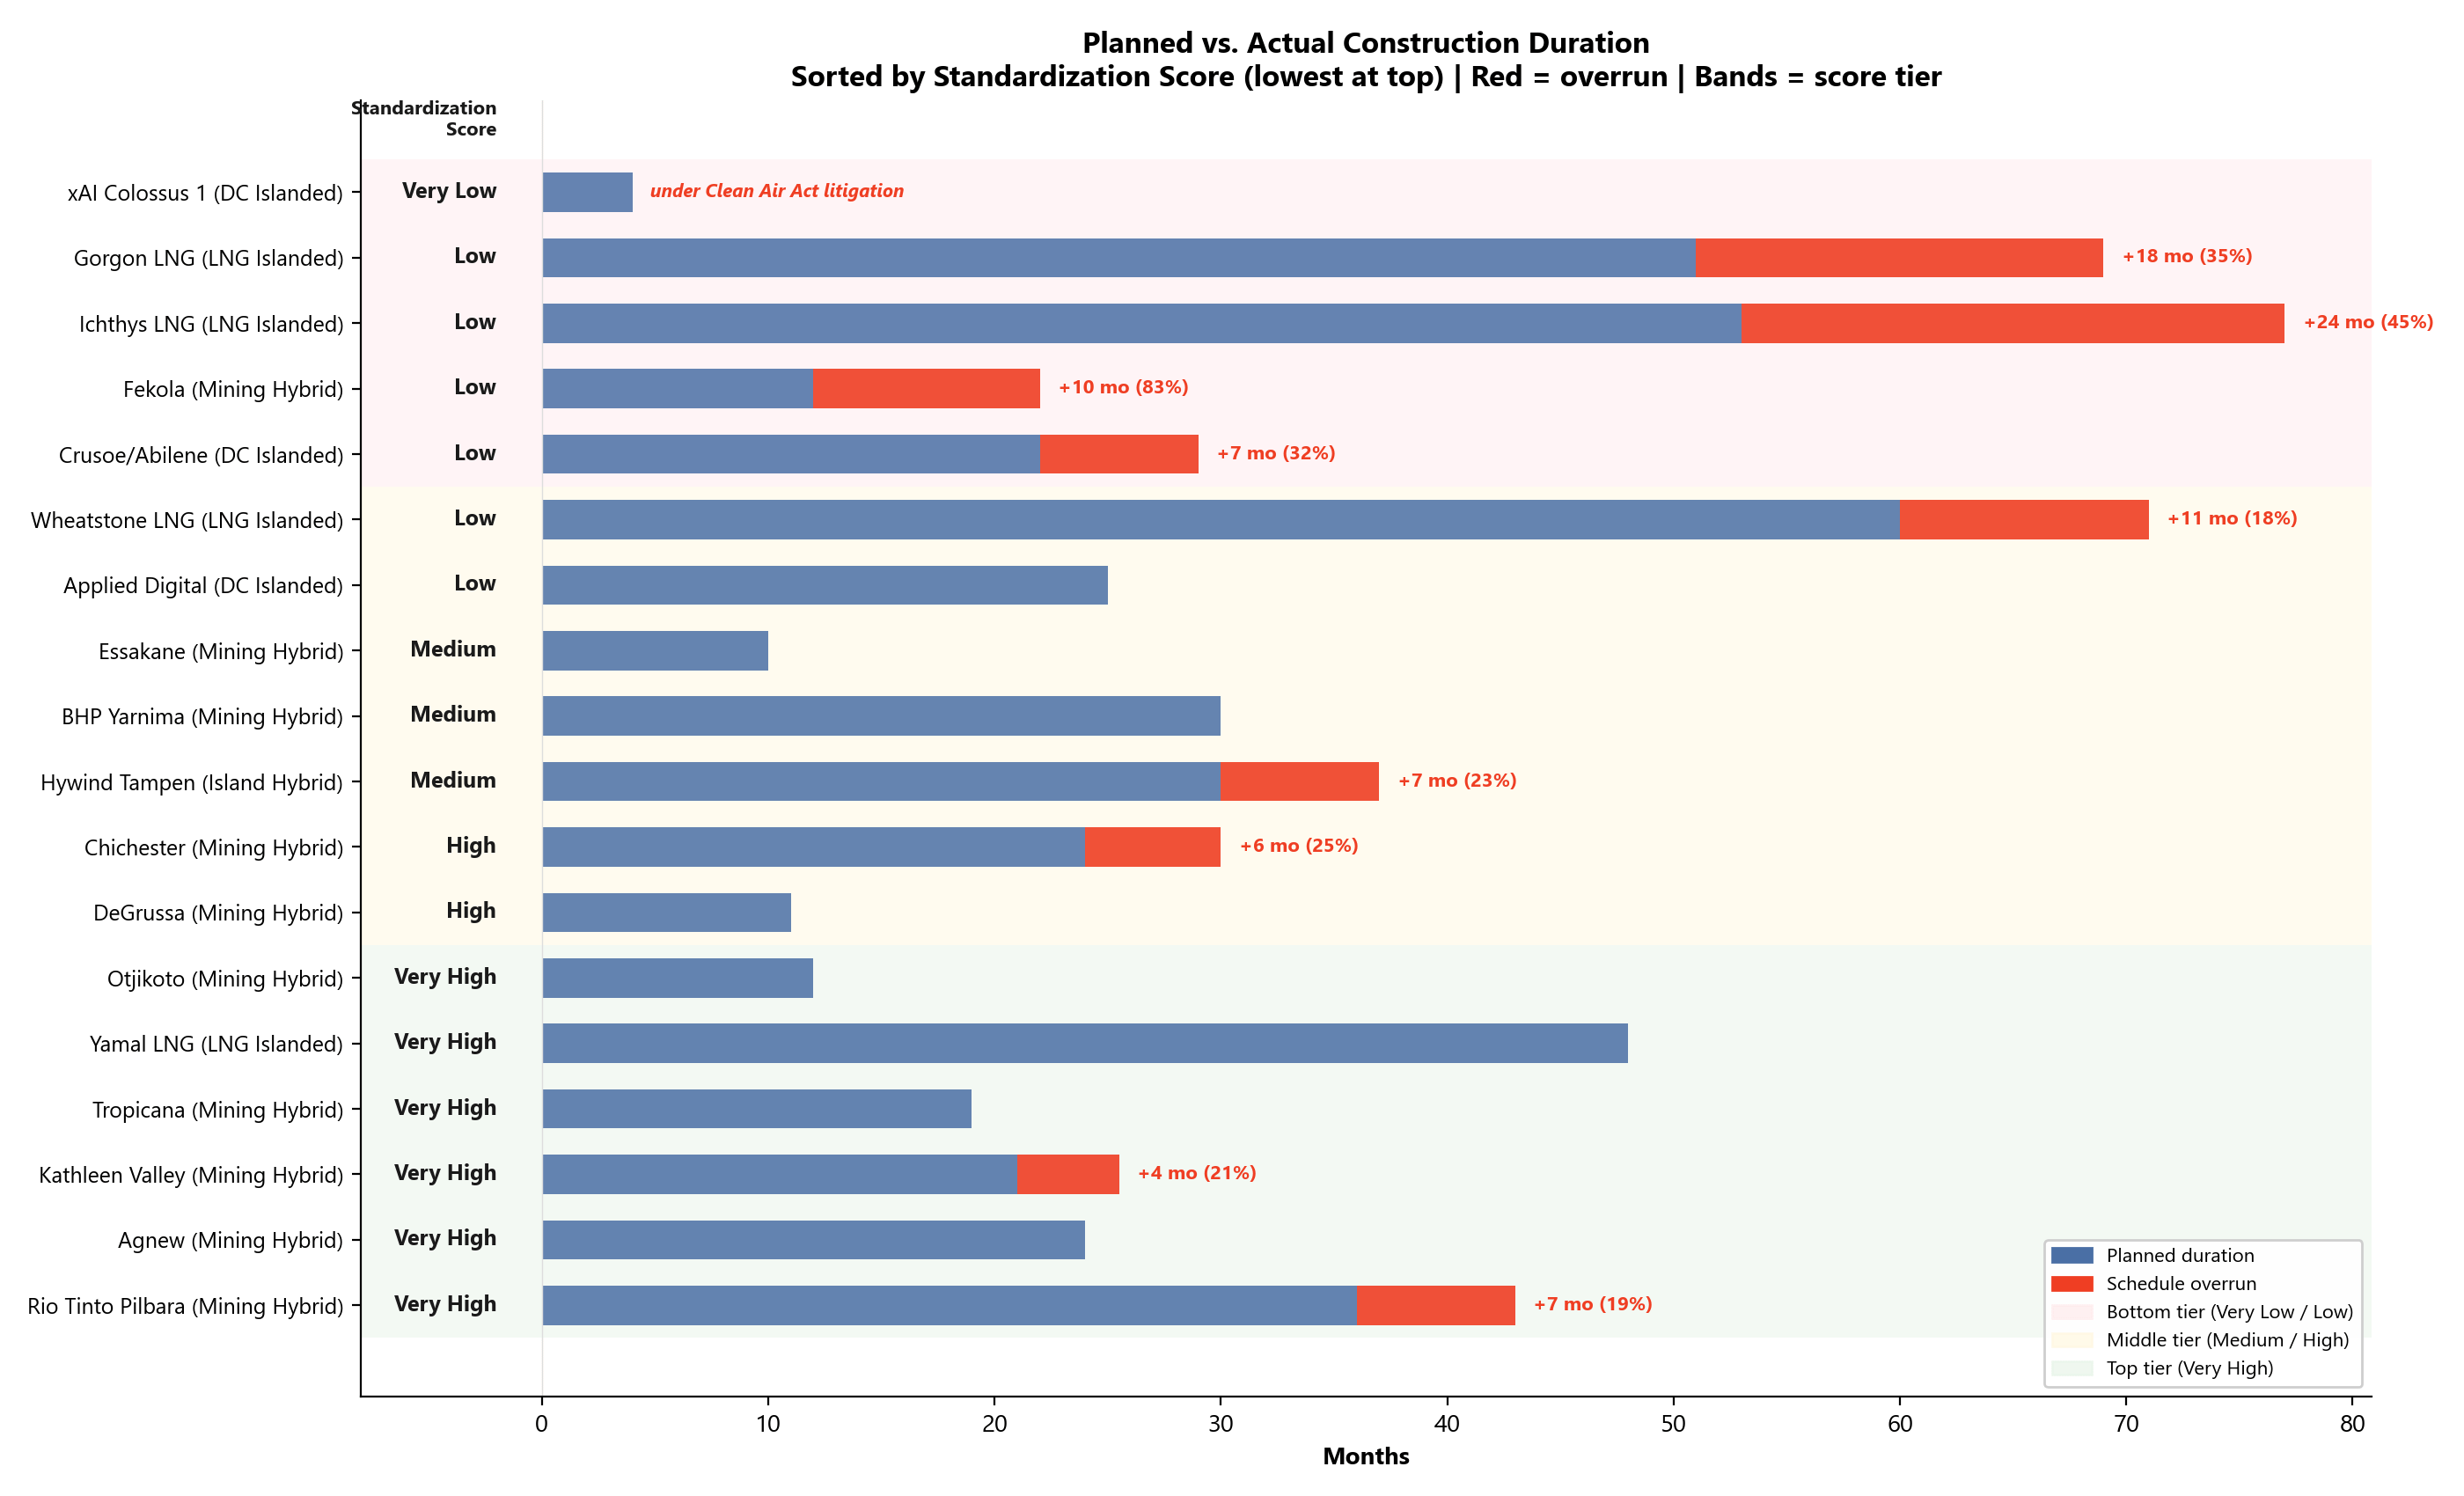
Across 18 projects, those in the top tier (tercile) of our Standardization Score averaged roughly 2 months of delay (67% on-time), compared to roughly 10 months for projects in the bottom tier (33% on-time). The biggest time savings appear before construction even starts: bottom-tier projects averaged 25 months from project announcement to breaking ground, versus ~5.5 months for top-tier projects. Commissioning was also faster for standardized projects (1.1 months vs. 5.4 months), indicating that proven designs and control platforms accelerate handover, not just construction. This result is not driven by pandemic or geopolitical disruptions: excluding the three projects most affected by COVID and Ukraine-related supply chain shocks, the same standardization advantage holds.
02 The market value deferred by delay is enormous, and the gap between standardized and bespoke delivery is worth billions per project.
Using Occam Edge’s Value of Earliness (VOE) framework, each GW-month of delay defers roughly $0.7-0.9 billion of market revenue opportunity ($10-12B/GW-year at 80-90% utilization). At the developer/infrastructure level, public lease disclosures suggest ~$150M per GW-month of contracted revenue at risk. Under a bespoke delivery approach, the estimated market value deferred is ~$3.5-4.5B per 500 MW campus, versus ~$0.7-0.9B under full standardization-a gap of $2.5-3.5B per project.
Building fast is not the same as building reliably. The fastest projects in raw MW-per- month terms - like xAI Colossus 1, which deployed 300 MW in just 4 months - score lowest on standardization because they prioritized speed over permitting, supplier diversity, and interface documentation. xAI is now facing Clean Air Act litigation for operating without environmental permits. For lenders and owners, on-time, on-budget, on-permit delivery is what actually reduces cost of delay - not raw construction speed.
03 Permitting readiness showed the strongest link to on-time delivery.
Projects that completed permitting in under 12 months averaged 1.4 months of schedule delay. Projects where permitting took over 3 years averaged 15 months of schedule delay- a 10x difference. These durations come from government regulatory records (TCEQ, LPSC, WA EPA, Norwegian PSA). The two projects that were built before permits were in place (xAI Colossus 1, Crusoe Abilene) both now face regulatory consequences including Clean Air Act litigation. The implication: modularity alone is not enough in determining standardization - xAI scored very high on modularity but very low on permitting readiness.
04 Standardization reduces exposure to the controllable risks behind the biggest delays.
When we tracked the risk events behind each project’s delays, a clear pattern emerged: permitting problems, financing issues, supply chain bottlenecks, and labor shortages showed up in 29-43% of bottom-tier projects and in zero middle- or top-tier projects. These are exactly the risks that repeatable design, established permit pathways, and proven delivery track records are designed to eliminate. By contrast, uncontrollable force majeure events (e.g. COVID, extreme weather, geopolitical conflict) hit projects across all tiers equally.
05 Hybrid renewable architectures scored higher on standardization and may reduce delay risk.
Projects combining gas generation with solar and battery storage in established jurisdictions scored significantly higher on our Standardization Score than gas-heavy DC-islanded projects in the U.S. (Very High vs. Low). The gap is not limited to permitting. Hybrid renewable architectures score higher on three of five standardization dimensions:
• Permitting readiness (gas turbines trigger Title V, NSR/PSD review, and CEMS requirements that solar and BESS do not)
• Design reuse (the Australian mining hybrids are serial deployments of nearly identical solar + BESS + gas packages across multiple sites, while DC-islanded projects are first-of-a-kind)
• Interface standardization (hybrid operators like EDL, Zenith, and Pacific Energy deploy proven microgrid control platforms across their portfolios)
Why it matters: The datacenter industry is building power systems at a scale and speed never before attempted. The difference between a 15-month and a 24-month construction timeline, repeated across dozens of GW-scale campuses, is the difference between meeting AI demand on schedule and a multi-billion-dollar infrastructure shortfall. Repeatable design, permitting readiness, and better interface discipline appear to be promising risk-reduction levers for financiers, owners, and policymakers to evaluate explicitly.
Before committing to off-grid or behind-the-meter power, stakeholders should pressure- test whether the expected time and cost savings materialize versus working with the existing grid in new ways. The tradeoff between procuring your own off-grid power and interconnecting with the grid may be narrower than assumed after accounting for months of potential project delays. GridCARE, an energy AI platform, is partnering with Portland General Electric to accelerate hundreds of megawatts of data center interconnections, reducing timelines from years to months by optimizing flexible resources like batteries and onsite generation on existing transmission infrastructure, without costly upgrades. The question for any given project is not whether to go on-grid or off-grid, but which path delivers reliable capacity fastest at the lowest total risk.
Identifying these patterns is the first step. Applying them to a specific project, across a specific site, with a specific supply chain, requires continuous assessment.
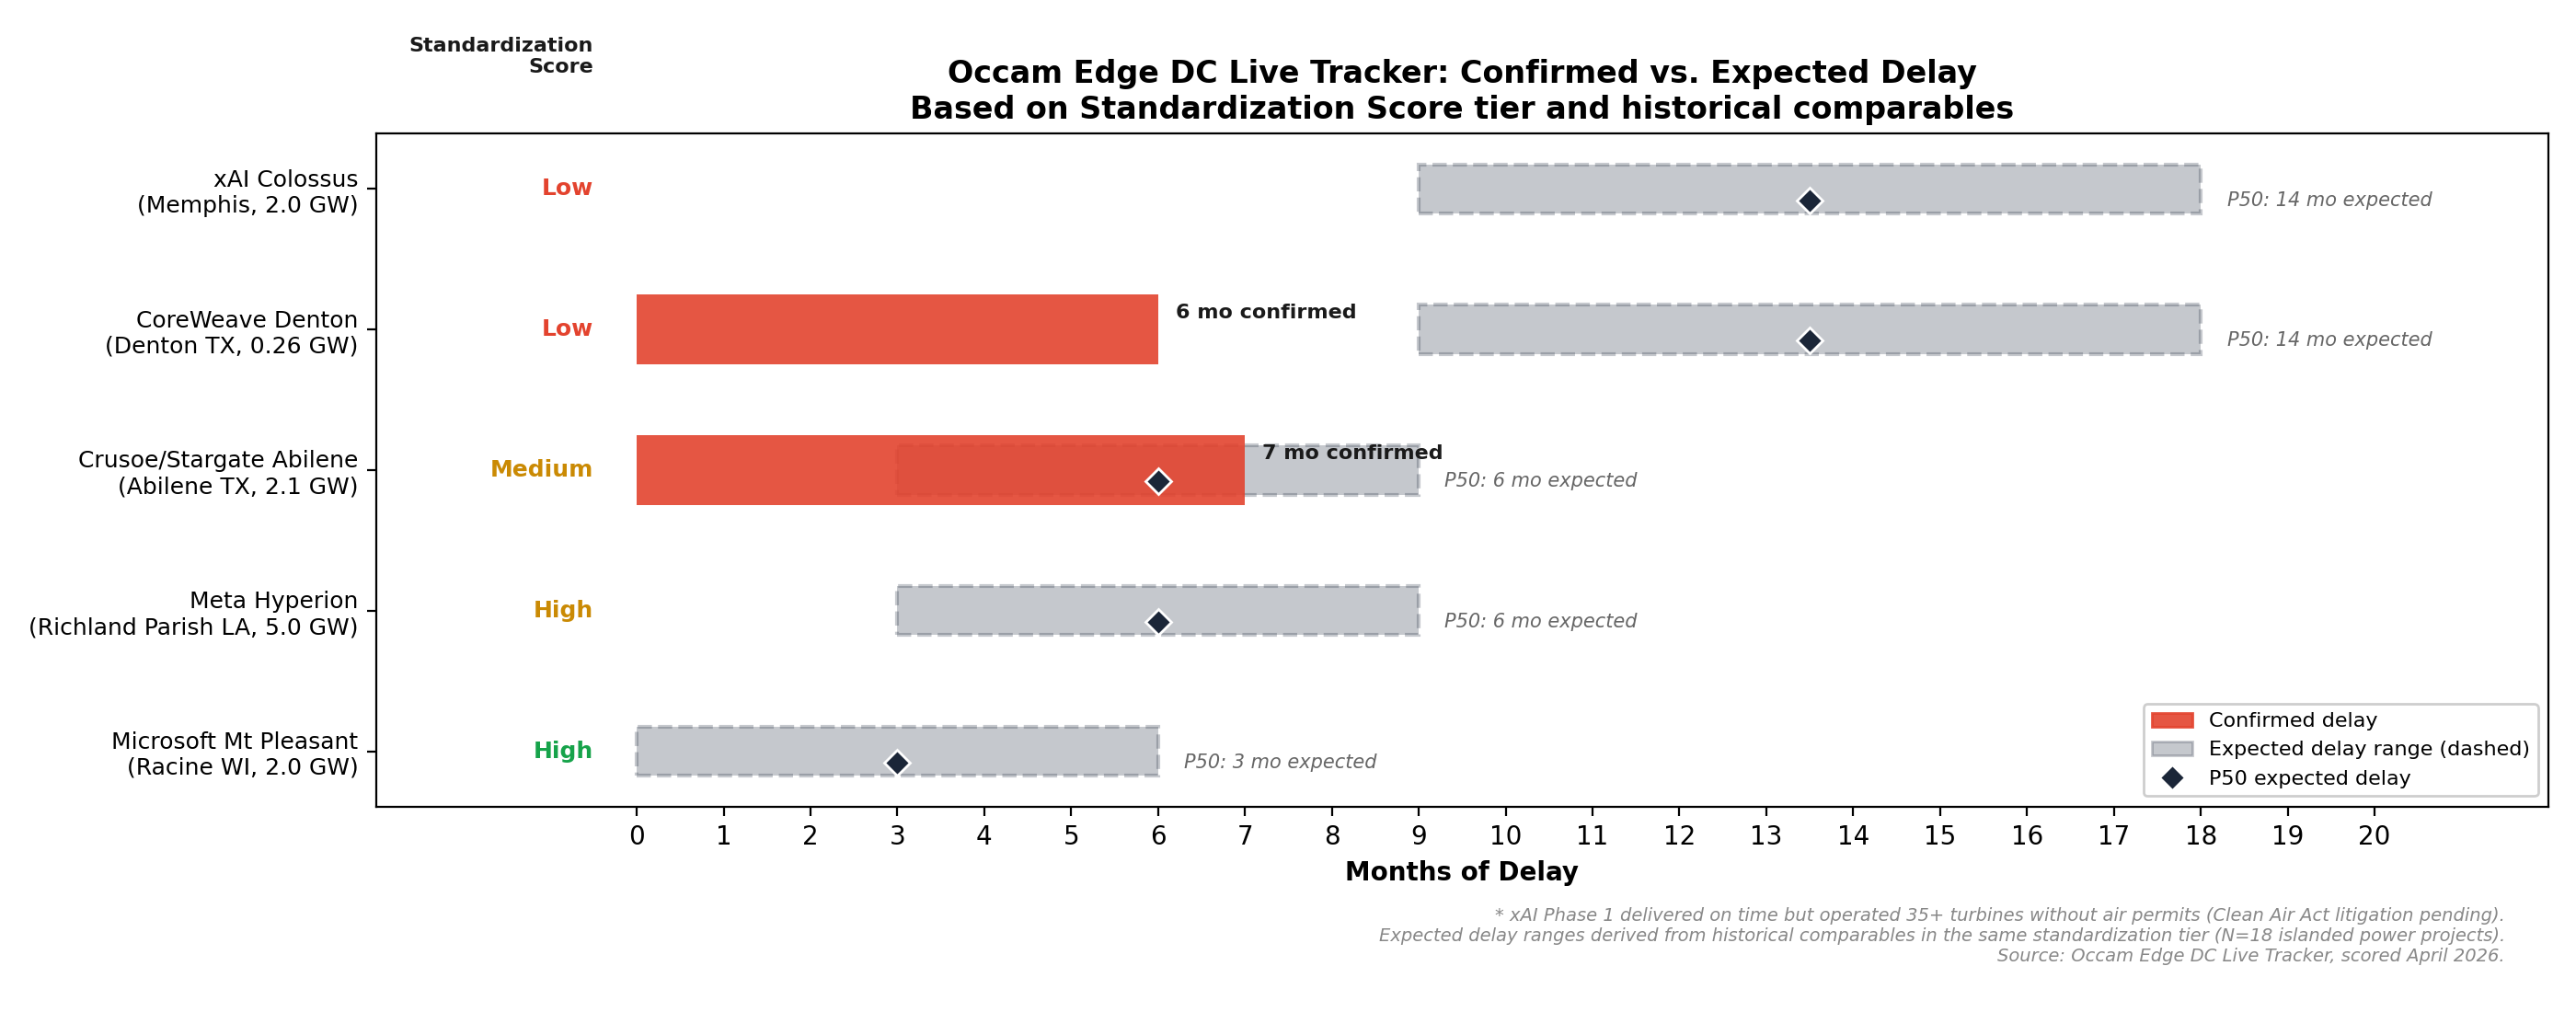
Occam Edge tracks execution risk across the datacenter power buildout in real time, helping investors, lenders, and developers understand where their projects are exposed and what to do about it before capital is at risk. We are actively tracking major DC power buildouts totaling over 11 GW through our DC Live Tracker, scoring each project across eight real-time risk dimensions including design standardization, permitting, interconnection, supply chain bottlenecks, local labor, and weather risks. Early results confirm the whitepaper’s findings: bottom-tier projects are already accumulating 6-7 months of delay, while the highest-scoring project remains on schedule.
Download Full White Paper
Interested in how Occam Edge quantifies technical and execution risk? Request a demo to see our platform in action.